
In my first days of keeping this account, I was able to observe that the cost per purchase was high and was not favorable for the company, they had a theory about how the advertising schedule should be invested, which I was able to confirm with Automated reports that we They allowed us to have a broad overview of what the strategy to carry out should be.
We decided to change the way advertising was spent and we obtained very favorable results which allowed us to determine how we were going to face Q4 2021.
After several meetings and data analysis, we decided to change the Facebook Guideline strategy and these were the results:
Old Form: Ad Spend from August 1 – August 24
The Investment Model in Advertising Guidelines was used with 28% directed to Traffic and 57% to Retargeting.

The cost per purchase averaged a total of Q79.24 and an average ROAS of 3.69
Additional Source: Google Data Studio.

Before deciding any action, the following Hypotheses were elaborated:
|
Facebook Hypothesis |
Expected Result |
|
Adding more budget to Retargeting |
Decreases ROAS and Increases cost per purchase |
|
When creating collections of catalog by category |
More sales will be obtained |
|
By increasing more budget to traffic |
The cost per purchase will decrease and ROAS increases |
|
By creating new audiences |
The cost per result |
|
Add more budget to Remarketing in 15 and 30 every month |
finish closing sales |
Advertising Investment of 25 August- September 3
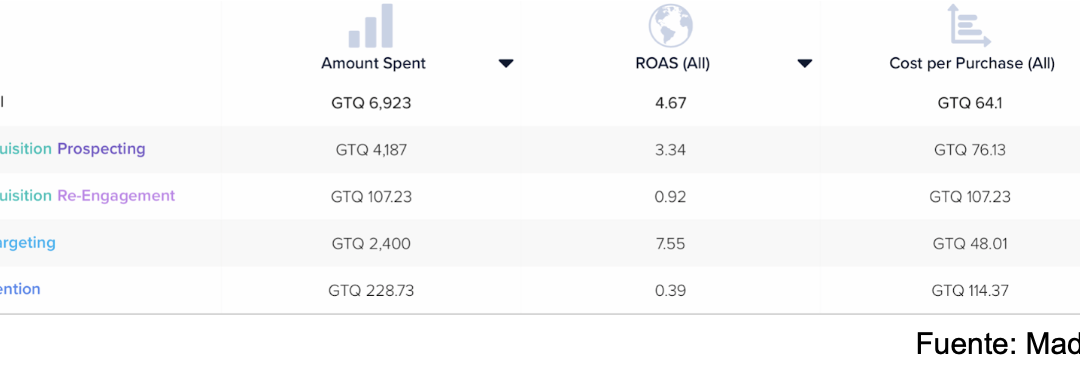
In the following image, the distribution of the advertising pattern was changed with 60% directed to Traffic and 35% directed to Retargeting
Image No. 2: Advertising Investment from August 25 to September 3

Source: Madgicx
It was possible to lower the cost per purchase from Q79.24 to Q64.1 with this model
Additional Source: Google Data Studio

The results obtained with these Changes are not 100% accurate until compared to the same period of time, but they give us a parameter to determine how the month of September will be managed.
Distribution of Budgets in Facebook Ads 1 Sep – 30 Sep
|
|
Investment |
Proportions |
|
Traffic |
Q 24,000.00 |
60% |
|
Conversions |
Q 8,000.00 |
20% |
|
Remarketing |
Q 8,000.00 |
20% |
|
Total |
Q 40,000.00 |
100% |
Comentarios recientes